Fault Zone Geometry and Historic Displacement Along the Cholame
Segment of the San Andreas Fault, Southern California
STONE, ELIZABETH M., Department of Geology, Arizona State University, Tempe, AZ 85287-1404, emstone@asu.edu;
ARROWSMITH, J RAMON, Department of Geology, Arizona State University, Tempe, AZ 85287-1404, ramon.arrowsmith@asu.edu;
RHODES, DALLAS D., Department of Geology and Geography, Georgia Southern University, Statesboro, GA 30460,
DRhodes@GaSoU.edu; GRANT, LISA B., Department of Environmental Analysis and Design, University of California,
Irvine, 262 Social Ecology I, Irvine, CA 92697-7070.
PROBLEM
The Cholame segment of the San Andreas Fault (SAF) is the transitional zone between the Parkfield segment to
the north (containing both creeping and locked zones) and the locked Carrizo segment on its southern end
(Fig. 1). Unlike both
the Parkfield and Carrizo segments where the SAF is typically a single well defined
trace, the geometry of the Cholame segment fault strands is variable on a kilometer scale. If segment length
scales with depth, the rupture pattern of the Cholame segment may be an important indicator in differences of
the downdip fault surface continuity.
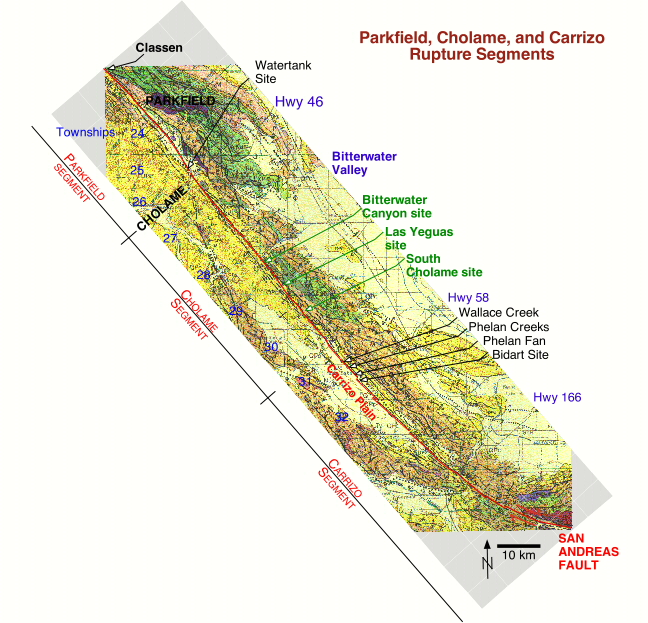 Figure 1. Important sites along the Parkfield, Cholame, and Carrizo segments of the SAF. Note the 73 km
between the existing paleoseismic sites in the Carrizo Plain and the Watertank site of Sims [1987]. The
Bitterwater
Canyon, Las Yeguas and South Cholame
sites, among others, will be investigated for their
suitability for paleoseismic investigation (green). James E. Freeman surveyed township boundaries from
township 24 to 32 in 1855 and 1856 (shown in blue), and Grant and Donnellan [1994] recovered original
monuments from that survey spanning the SAF in the Carrizo Plain near Wallace Creek. The intersections
between the state highways in the area and the SAF are shown. The background is from the 1:750,000 scale
state geologic map [Jennings, et al., 1977].
Figure 1. Important sites along the Parkfield, Cholame, and Carrizo segments of the SAF. Note the 73 km
between the existing paleoseismic sites in the Carrizo Plain and the Watertank site of Sims [1987]. The
Bitterwater
Canyon, Las Yeguas and South Cholame
sites, among others, will be investigated for their
suitability for paleoseismic investigation (green). James E. Freeman surveyed township boundaries from
township 24 to 32 in 1855 and 1856 (shown in blue), and Grant and Donnellan [1994] recovered original
monuments from that survey spanning the SAF in the Carrizo Plain near Wallace Creek. The intersections
between the state highways in the area and the SAF are shown. The background is from the 1:750,000 scale
state geologic map [Jennings, et al., 1977].
There are sparse data for the paleoseismic history of this little-studied fault segment. In contrast, the
recent rupture histories of the Parkfield and Carrizo segments have been fairly well documented. Locating
optimal trench sites
for earthquake recurrence studies requires careful geologic and geomorphic mapping in
order to understand the context of the sites (Fig. 2). Careful determination of surface offset is also
important to understand the fault properties (Fig. 3).


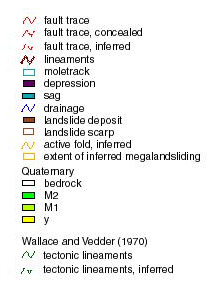 Figure 2. Photo mosaic and geologic map of southern Cholame segment of the San Andreas Fault. Linework
from field mapping on the aerial photos was heads-up digitized in Imagine and
cleaned in Arc/INFO.
Coverages were compiled into the final map using ArcView and the USGS program A-la-Carte provided symbology.
The photos for the aerial photo base were provided by the Fairchild Collection at Whittier College. They
were rectified against the topographic maps in ERDAS Imagine.
Figure 2. Photo mosaic and geologic map of southern Cholame segment of the San Andreas Fault. Linework
from field mapping on the aerial photos was heads-up digitized in Imagine and
cleaned in Arc/INFO.
Coverages were compiled into the final map using ArcView and the USGS program A-la-Carte provided symbology.
The photos for the aerial photo base were provided by the Fairchild Collection at Whittier College. They
were rectified against the topographic maps in ERDAS Imagine.
The landscape development that we infer along the San Andreas has resulted in an excellent example of the
distinctive topography which occurs as structural and geomorphic processes act together along active
strike-slip fault zones. On the smallest spatial scale, steps in the individual fault strands can produce
active domes and basins oriented parallel to the fault. On the largest spatial scale, the central Cholame
segment landscape is dominated by the classic "Rift Zone"
expression which results from the interaction between the tectonic processes of fault slip and local
deformation and the geomorphic processes of fluvial erosion and landsliding.
TOOLS
Geologic and geomorphic mapping were conducted on three separate trips (March, May and August of 1998)
for a total of 18 field days. The aerial photographs were provided courtesy of the Fairchild Aerial
Photograph Collection, Whittier College. These photographs were rectified and mosaicked using ERDAS Imagine.
Linework on maps is an Arc/INFO GIS. The topographic maps of the three trench sites were surveyed using a
total station and plotted using LisCad.
RESULTS
Fault zone geometry
Discontinuous on a kilometer scale
Fault zone contains areas with 2 recently active traces and no active faults conspicuous
(central portion of map area)
Fault strands may strike up to 10 degrees away from general fault strike for this area
(N40W)
Paleoseismic data
Small offset channel (~25m) on Whaleback
Large offset valley (~400m) on Whaleback
Offset ridge (~40 m)
Three potential trench sites: Bitterwater
Canyon, Las Yeguas and South Cholame
Landscape development
Active doming (Whaleback) and resulting incision of
Bitterwater Creek
Landsliding at a variety of scales
2-D Dislocation modeling
 Figure 3. Offset data for the Cholame and the Carrizo segments compared to offsets modeled with variable
stressdrops on the two segments. The curve for TCholame/TCarrizo=1 shows the effect on the slip
distribution of the deepening fault zone alone. As the strength of the Carrizo segment relative to that
of Cholame increases, the segment boundary becomes more clearly defined by the change in offset. The
model does not fit the data on the southeast end of the Carrizo segment because the San Andreas fault
trace geometry changes as it enters the Big Bend and the loading geometry changes (unlike the constant
strike of the of the modeled fault surface). Strike-slip offset would be expected to decrease in this
area characterized by an increase in the compressive normal traction and a decrease in the shear traction
along the fault surface. This frictionless model was run using DIS3D Erikson, 1987) and used a constant
stressdrop for each fault segment. Modeling mesh size was 2km x 2km.
Figure 3. Offset data for the Cholame and the Carrizo segments compared to offsets modeled with variable
stressdrops on the two segments. The curve for TCholame/TCarrizo=1 shows the effect on the slip
distribution of the deepening fault zone alone. As the strength of the Carrizo segment relative to that
of Cholame increases, the segment boundary becomes more clearly defined by the change in offset. The
model does not fit the data on the southeast end of the Carrizo segment because the San Andreas fault
trace geometry changes as it enters the Big Bend and the loading geometry changes (unlike the constant
strike of the of the modeled fault surface). Strike-slip offset would be expected to decrease in this
area characterized by an increase in the compressive normal traction and a decrease in the shear traction
along the fault surface. This frictionless model was run using DIS3D Erikson, 1987) and used a constant
stressdrop for each fault segment. Modeling mesh size was 2km x 2km.
This modeling compliments the research efforts of Lisa Grant, who is
working to determine the far field fault-parallel displacement using the
changing lengths of surveyed corner markers (Fig. 4,5).
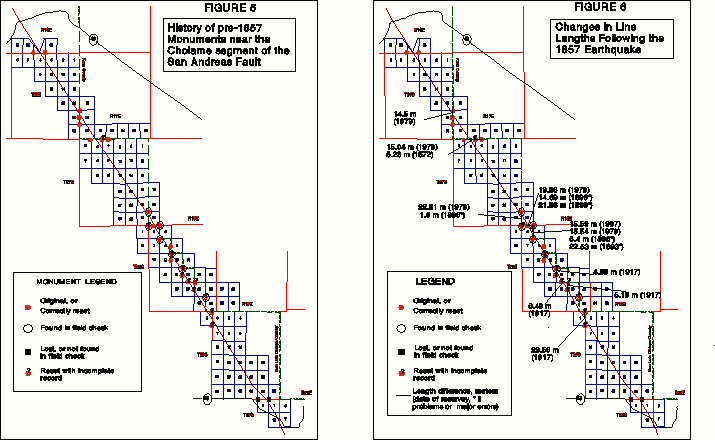 Figures 4 and 5. Preliminary analysis of data from 1855 and subsequent surveys in several locations
across the SAF indicate that several meters displacement occurred in 1857 over a 1 mile wide zone
spanning the Cholame segment. There are large uncertainties in the reliability and precision of the
measurements. Additional analysis and paleoseismic data are needed to reduce the uncertainty.
Figures 4 and 5. Preliminary analysis of data from 1855 and subsequent surveys in several locations
across the SAF indicate that several meters displacement occurred in 1857 over a 1 mile wide zone
spanning the Cholame segment. There are large uncertainties in the reliability and precision of the
measurements. Additional analysis and paleoseismic data are needed to reduce the uncertainty.