 |
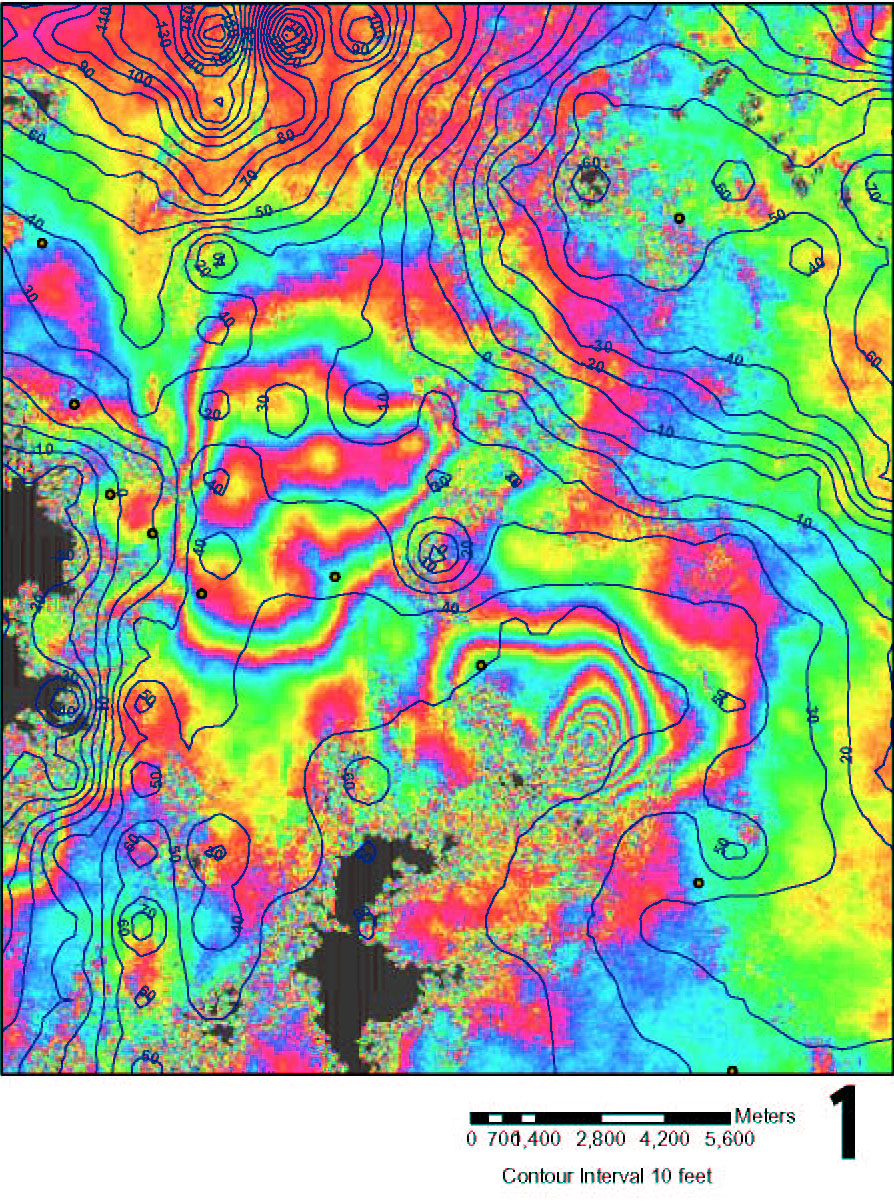
This image is used to illustrate the lack of correlation between the declining water table elevation and the amount of deformation. The contour lines represent the change (~decline) in feet of the water table from 1983 to 2000. The greatest decline (~160 ft) occurred in the NW corner of the image, while the area around the subsidence bowl experience ~50 ft. Drill logs and hydrogeologic reports will be further investigated to determine the influence of the stratigraphy. |