Contouring in Matlab
Davis' data
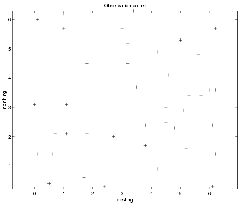
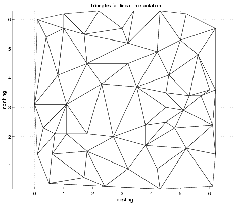
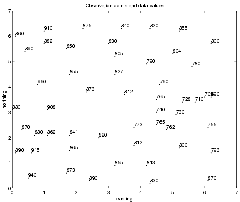
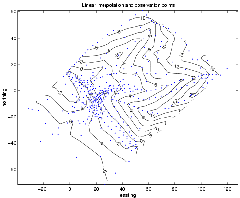
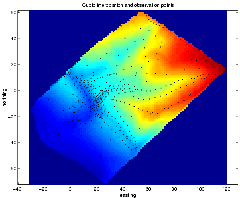
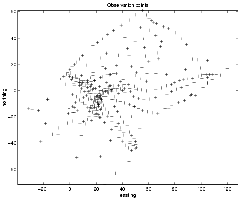
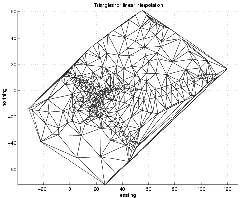
For this investigation of contouring, we use the DMAP.DAT dataset from Middleton's book.
Here is the script that I wrote that visualizes these data:
davis.m
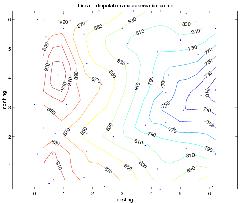
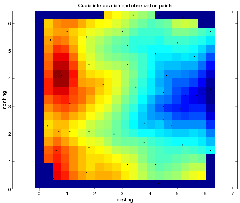
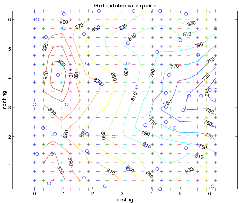
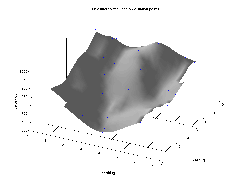
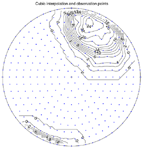
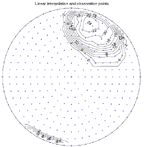
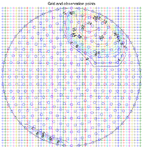
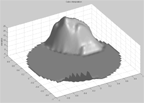
Here are pictures of the plots that the script makes:
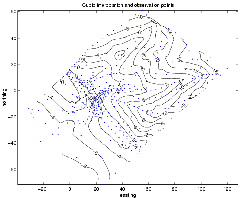
Exercise 2--San Andreas Fault slip rate. We studied some surveyed topographic data from a field site along the San Andreas Fault.
Here is a link that talks about these data from an old class web site:
http://www.public.asu.edu/~arrows/glg490/GLG490--DeltaLab.html
Here is the script that I wrote that visualizes these data:
vmscript.m
Here are the data:
vm.txt
Here are pictures of the plots that the script makes:
Exercise 3--Contouring on the stereonet using the Kalsbeek net.
Here is the script that Don Ragan and I wrote that visualizes these data:
FabDiagramjra.m
Here are the data:
X18pt.dat
Here are pictures of the plots that the script makes:
Pages maintained by
Prof. Ramón Arrowsmith
Last modified December 7, 2001

