ITR/IM: Taking the pulse of an expanding urban
region: Greater Phoenix now and what it
could be in 2100
VERSION 1.0
A
preproposal to the NSF-Information Technology Research Program (Information
Management and Applications): Group
proposal, <$1M/yr for 5 years.
Ramon
Arrowsmith, Department of Geological Sciences and Frederick Steiner, School of
Planning & Landscape Architecture Arizona State University
And
Robert
Bolin, ASU Sociology (bob.bolin@asu.edu)
Malcolm
Comeaux, ASU Geography (comeaux@asu.edu)
Jana Fry,
ASU Information Technology (jana.fry@asu.edu)
Glen S.
Krutz, ASU Political Science (Glen.Krutz@asu.edu)
Peter
McCartney, ASU Archeological Research Institute (peter.mccartney@asu.edu)
Robert
Mings, ASU Geography (Mings@asu.edu)
Melissa
Niederhelman, ASU School of Design (Melissa.Niederhelman@asu.edu)
Ron Dorn,
ASU Geography (RONALD.DORN@asu.edu)
Joseph
Zehnder, ASU Geography (Joseph.Zehnder@asu.edu)
In collaboration with
The Los Alamos Urban Security team
(http://www.ees.lanl.gov/EES5/Urban_Security/)
Grant Heiken
Embracing complexity
We are challenged by an
opportunity: interactions between humans and their environment are so
complicated that each is typically studied in isolation, yet proximity of
cities and towns to wild lands and pristine landscapes calls for a more
integrated approach to understanding them.
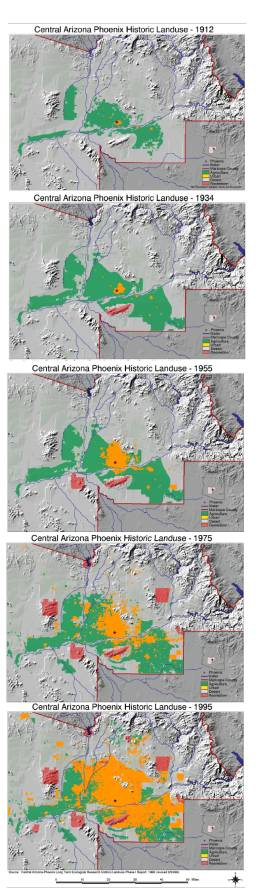
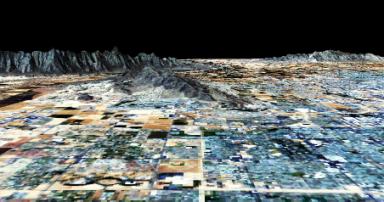
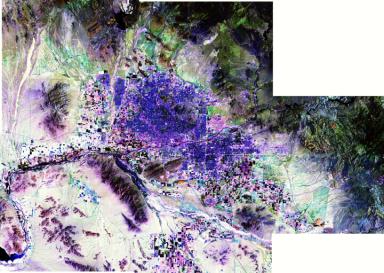
The greater Phoenix
Arizona region comprises a desert landscape transforming to an urban center
(Figures 1 and 2). The population of
the region has doubled in the last 20 years and is expected to double again in
the next 20. What are the flows of
materials, people, other biota, and how do the changes depend on history and
the current configuration? What does it
mean to grow so rapidly? We propose to
take the pulse of the region and present a prognosis for growth. We may explore interventions to keep the
region healthy. We want to know what
has happened (all of the different parameters describing the region such as
biophysical features, the built environment, and demographics and their variation
with time), what is happening, and what can happen. To describe the history, we need to put together the
datasets. Many are available off the
shelf from the various stakeholders (municipalities, county, state, federal,
private, academic entities). To figure
out what is happening, we need to establish a means of maintaining the
databases that are built and their connectivity and gather new data, so we have
the pulse of the region. To anticipate
the future, we have to train our models on the history, situate them in the
present, and send them forward and test the results and visualize the various
scenarios.
The opportunity that the greater
Phoenix region presents is one of many datasets with varying degrees of
interoperability that need to merged using the tools of information technology
to develop both theoretical understanding of how cities develop as ecosystems
in relation to their surroundings, as well as the application to managing
growth. Growth management is a much
debated issue in the region. It has been the subject of legislative action,
blue ribbon panels, and ballot-box initiatives. What has been missing is
in-depth scientific analysis of the consequences
of the
various growth management options.. We
can take the complex array of information and use visualization tools to
present the spatial relationships among the disparate datasets. More importantly, we can look at the time
dimension to produce a history of change and explore the future as parameters
vary.
 In
our discipline-oriented work, we reduce complexity to understand. We segregate phenomena to look at individual
elements. However, to think about the
past, present, and future of urban systems such as Phoenix, in which processes
are complexly intertwined, we need the power of computer simulation and
visualization to understand and represent the system. Tools developed for visualizing networks applied to the internet
are an example of the potential for unanticipated linkages among diverse
datasets along non geographic dimensions (http://www.cs.bell-labs.com/who/ches/map/index.html). Such research is at the forefront in
Information Technology, and can be challenged by the diverse datasets
associated with the greater Phoenix region.
In
our discipline-oriented work, we reduce complexity to understand. We segregate phenomena to look at individual
elements. However, to think about the
past, present, and future of urban systems such as Phoenix, in which processes
are complexly intertwined, we need the power of computer simulation and
visualization to understand and represent the system. Tools developed for visualizing networks applied to the internet
are an example of the potential for unanticipated linkages among diverse
datasets along non geographic dimensions (http://www.cs.bell-labs.com/who/ches/map/index.html). Such research is at the forefront in
Information Technology, and can be challenged by the diverse datasets
associated with the greater Phoenix region.
Not only should we bring diverse
datasets together and establish the tools for their inquiry and visualization,
but also we can tap into data streams that give us the short term
representation of what is happening.
For example, traffic data are gathered in real time by the Arizona
Freeway Management system (http://www.azfms.com/), and even more importantly
for the desert large water management groups (such as the Salt River Project;
http://www.srpnet.com ) track their water flows carefully (Figure 3). Tapping into these and many other data
streams will let us compare short term high resolution datasets and their
variations with those collected over longer time periods and also anticipate
future behavior and data collection.
Changing how atlases are constructed
 From
Merriam-Webster Dictionary: “Atlas: 3a:
a bound collection of maps often including illustrations, informative tables,
or textual matter b : a bound collection of tables, charts, or plates.” One of the products of our work will be the
construction of an electronic and ecological atlas of the greater Phoenix
metropolitan area. This digital atlas
will contain constantly updated representations of biophysical features (such
as climate, air, geology, physiography, hydrology, soils, flora, and fauna);
built environment (such as prehistoric settlement, development history, current
land use, housing, transportation, planned land use, landscapes, business
types, tax capacity/real estate value); and demographics (such as population
growth, population density, employment growth, median household income)
ethnicity, age distribution, and migration and mobility). These data will be compiled by ASU experts
with the aid of staff supported by this grant.
They will include historic data such that changes in the parameters can
be compared in a common framework.
Major historic time periods are Quaternary (last 1.6 million years),
Holocene (last 10 thousand years), prehistoric, Hispanic exploration and
settlement, pre-1900 American exploration and settlement, pre-WWII settlement,
1950s and 1960s modest growth, and 1970s-2000 explosive growth. Furthermore, we will include forecasts of
changes in these parameters over these future time periods: 2005, 2010, 2050, 2100. Interaction with the
atlas will use virtual reality tools (such as 3D visualization and texture
mapping and color along with animation to provide the 4 dimensional
perspective).
From
Merriam-Webster Dictionary: “Atlas: 3a:
a bound collection of maps often including illustrations, informative tables,
or textual matter b : a bound collection of tables, charts, or plates.” One of the products of our work will be the
construction of an electronic and ecological atlas of the greater Phoenix
metropolitan area. This digital atlas
will contain constantly updated representations of biophysical features (such
as climate, air, geology, physiography, hydrology, soils, flora, and fauna);
built environment (such as prehistoric settlement, development history, current
land use, housing, transportation, planned land use, landscapes, business
types, tax capacity/real estate value); and demographics (such as population
growth, population density, employment growth, median household income)
ethnicity, age distribution, and migration and mobility). These data will be compiled by ASU experts
with the aid of staff supported by this grant.
They will include historic data such that changes in the parameters can
be compared in a common framework.
Major historic time periods are Quaternary (last 1.6 million years),
Holocene (last 10 thousand years), prehistoric, Hispanic exploration and
settlement, pre-1900 American exploration and settlement, pre-WWII settlement,
1950s and 1960s modest growth, and 1970s-2000 explosive growth. Furthermore, we will include forecasts of
changes in these parameters over these future time periods: 2005, 2010, 2050, 2100. Interaction with the
atlas will use virtual reality tools (such as 3D visualization and texture
mapping and color along with animation to provide the 4 dimensional
perspective).
 Access to the atlas will include raw
data availability, as well as web-based tabular, graphical, and virtual reality
representations. We imagine a website
that includes interactive maps, but also N-Dimensional representations (in
which 3 dimensions come from the spatial aspects of the view, a fourth
dimension from time, and the variation of other parameters denoted by color or
texture map variations). These data would
be easily accessible. We will apply information
technology to the analysis and synthesis of information, data fusion, data
mining, visualization, simulation, and web-based multilevel user
(student/decision maker/scientist) inquiry. At ASU, we expect to
establish a Decision Theater in which high quality audio and visual presentation
systems such as a 180 degree screen with 3D visualization capability will
present a synthetic environment along with comfortable ergonomics in which
we can bring decision makers together and explore the data, their connections,
and dfferent scenarios for change (Decision Theater). We do not expect to develop a full immersion
synthetic environment (i.e., C2 or C6 at the Virtual Reality Application
Center, http://www.vrac.iastate.edu/),
but the theater will be capable of high resolution stereoscopic viewing using
shuttered glasses and a large panoramic semi-circular screen. The system will be driven by a Silicon
Graphics Reality Center (http://www.sgi.com/realitycenter/)
that will provide high resolution real-time interactivity with the urban eAtlas
data and models. The Theater may be
part of the recently established ASU-JPL extended mission facility. While the interaction with
data and models will be vigorous in the Decision Theater, web-based multimedia,
text, data download and upload, and modeling tools access will be seemless and
a visitor to the Decision Theater would be able to revisit a given scenario
from the web.
Access to the atlas will include raw
data availability, as well as web-based tabular, graphical, and virtual reality
representations. We imagine a website
that includes interactive maps, but also N-Dimensional representations (in
which 3 dimensions come from the spatial aspects of the view, a fourth
dimension from time, and the variation of other parameters denoted by color or
texture map variations). These data would
be easily accessible. We will apply information
technology to the analysis and synthesis of information, data fusion, data
mining, visualization, simulation, and web-based multilevel user
(student/decision maker/scientist) inquiry. At ASU, we expect to
establish a Decision Theater in which high quality audio and visual presentation
systems such as a 180 degree screen with 3D visualization capability will
present a synthetic environment along with comfortable ergonomics in which
we can bring decision makers together and explore the data, their connections,
and dfferent scenarios for change (Decision Theater). We do not expect to develop a full immersion
synthetic environment (i.e., C2 or C6 at the Virtual Reality Application
Center, http://www.vrac.iastate.edu/),
but the theater will be capable of high resolution stereoscopic viewing using
shuttered glasses and a large panoramic semi-circular screen. The system will be driven by a Silicon
Graphics Reality Center (http://www.sgi.com/realitycenter/)
that will provide high resolution real-time interactivity with the urban eAtlas
data and models. The Theater may be
part of the recently established ASU-JPL extended mission facility. While the interaction with
data and models will be vigorous in the Decision Theater, web-based multimedia,
text, data download and upload, and modeling tools access will be seemless and
a visitor to the Decision Theater would be able to revisit a given scenario
from the web.
 General Research Questions
-What is the past, present,
and future distribution of materials and processes in an expanding urban region
located in a semi-arid setting and what are the controls of and drivers for
change? How is change dependant on history and the current configuration?
-Can we apply multiscale, coupled,
deterministic and empirical models to the complex urban-desert system
accurately enough to make useful predictions with regard to relevant issues
such as air and water quality, real estate values, wildlife distributions,
etc.?
-What information technology
innovations can help us transfer knowledge to all levels of interested groups:
scientists, decision makers, students, voters?
Specific Information
Technology, urban studies, urban ecology challenges
1)
Land use
modeling. What is the future of
Phoenix? Given its history, can we
develop a model that has a calibrated probability for landuse transitions based
upon history (see figure 1), what is near and what is far, and connectivity to
test scenarios for development? Can we
go beyond the empiricism to apply some mass balance or other potentially
deterministic constraints to improve the basis of the forecasts?
2)
What are the
relationships between land use and climate?
Can observations and models of climate (including air quality) be used
to evaluate land use change or its likelihood (Figures 1 and 3)? Can we go the other way and use observations
and models of land use (an other parameters) to anticipate climate (or air
quality changes)?
3)
What are the
relationships between geology/topography/physiography and open space? Are the mountains which present natural
limitations (and threats via the washes that drain them) to development the
optimum open space geometries? What are
the optimal geometries of open space and the feature content for land use
relative to development pressures?
4)
What are the
natural and artificial patterns of vegetation and water flow? What happens to a water droplet as it enters
the Phoenix system either aritifially (having started as rainfall in the upper
Colorado River Basin), or naturally as rainfall within the greater Phoenix
area?
5)
In the next
five years (i.e., the lifetime of the proposed project), urban growth and thus
major change will occur in to zones of the greater Phoenix region: the outer fringe where desert is converted
to urban land use, and the interior along the major drainages. In particular, major development is expected
along the Salt River. The Tempe Town
Lake is an active example of this development.
The Rio Salado Project (http://www.tempe.gov/rio/) will probably
rejuvenate the Salt River corridor through south Phoenix, and along it a new
Light rail system will carry people and promote development. This growth prognosis provides us with an
important target for documentation and analysis. We can provide an unprecedented dataset that captures the rapid
changes in all of the processes of the natural and urban system.
6)
Representation
is a major challenge. As we argued in
the introduction, the reduction of complexity to promote understanding is
common, but may be a limiting activity in the analysis of the urban
system. Furthermore, in the process of
bringing data together, we find that some so-called data include much
interpretation (geologic maps, census tracts, etc.) in contrast to
uninterpreted data such as remotely sensed imagery, raw data streams, etc. How we can represent the different aspects
of the greater Phoenix region in a coherent way? What about the scales of resolution in time and space? What is the uncertainty in the parameters
and how can it be presented as part of the inquiry?
7)
What is
common: time and space. How do we develop models of the
processes? Establish governing rules
for change and then check by taking snapshots.
We can also substitute space for time and look at different places (the
edge versus the interior of the urban environment) as an indicator of possible
change at a single place in time.
8)
What is
meaningful? Is it useful to compare
soil nitrogen versus voting blocks?
9)
Are layers
of data spatially referenced and temporally registered the best way to think
about the problem? What is the best way
to represent connectivity and pathways and processes?
10)
A couple of
basic themes in urban ecology come out in the American Scientist article by
Collins, et al ( Collins, Kinzig, Grimm, Fagan, Hope, Wu, and Borer, 2000, A
new urban ecology: American Scientist,
v. 88, p. 416-425.):
a)
Quantification
of the ecological footprint of the city.
How much natural productivity (measured in area) is required to support
the city?
b)
What is the
total energy expenditure per square meter for various portions of the greater
Phoenix area?
c)
What is the
variability in process types and rates with position (relative to the city
center(s)) or landuse type, or geologic or terrain unit?
d)
Can we
quantify or characterize the effects of forces of change and their timescales
in the urban ecosystems (disturbance events, ecological succession, disturbance
regions, land conversion, evolutionary change, climate change, erosion and
deposition)?
e)
What is the
probability of patch transition in space and time?
Table 1. Indices of change and the supporting data sources (acronyms are
defined at the bottom of the table).
These data will be compiled and form the basis of the urban eAtlas, as
well as model calibration.
ADE
Arizona Department of Education (http://www.ade.state.az.us/)
ADEQ
Arizona Department of Environmental Quality (http://www.adeq.state.az.us/)
ADHS
Arizona Department of Health Services (http://www.hs.state.az.us/)
ADJC
Arizona Department of Juvenile Corrections (http://www.juvenile.state.az.us/)
ADOC
Arizona Department of Commerce (http://www.azcommerce.com/)
ADOT
Arizona Department of Transportation (http://www.dot.state.az.us/)
ADWR
Arizona Department of Water Resources (http://www.water.az.gov/)
AGFD
Arizona Game and Fish Department (http://www.gf.state.az.us/)
ALRIS The
Arizona Land Resource Information System (http://www.land.state.az.us/alris/alrishome.html)
AOC
Administrative Office of the Courts for Arizona (http://www.supreme.state.az.us/aoc/)
CAP-LTER
Central Arizona-Phoenix Long Term Ecological Research (http://caplter.asu.edu/)
CES ASU
Center for Environmental Studies (http://www.asu.edu/ces/)
EPA
Environmental Protection Agency (http://www.epa.gov/)
GRSL ASU
Geological Remote Sensing Laboratory (http://elwood.la.asu.edu/grsl/)
MAG
Maricopa Association of Governments (http://www.mag.maricopa.gov/)
Seidman L.
William Siedman Research Institute at the ASU College of Business
(http://www.cob.asu.edu/Seid/index.html)
Real time data streams
and determination of high frequency mass and energy balances
We can tap
into data streams of information sampled at frequencies of daily or higher and
attempt to provide an estimate of the energy expenditure and mass flux per
square meter for various portions of the greater Phoenix area. Given the geographic isolation of the
greater Phoenix area (figure 2), we can take total traffic (including trucking)
in and out of the area on the major highways, and couple that with air and rail
traffic, solid waste, sewage, water, recycling, shipping and receiving,
construction, gravel mining, power and power demand, and other data to depict
the urban system in an unprecendented ecological light.
Looking forward
logistically
Given
ASU’s strengths in remote sensing and ties to JPL and NASA, we may take a
leadership role in the acquisition of high repeat time satellite or ultra high
altitude dirigible remotely sensed data of the greater Phoenix area. With a cost on the order of $30-50M, a
satellite system with an appropriate orbit could be tasked to provide high
resolution (cm-dm scale) daily or weekly coverage of the region. Such a data stream would provide
undprecendented monitoring potential, as well as information management challenges. To prepare for such a project, we will
develop information management protocols and calibrations for urban/natural
system monitoring.
Scenarios to explore with
multiscale coupled models and high quality data
The power
of the urban eAtlas goes beyond its dynamic depiction of the rich natural and
urban landscape. We expect to be able
to use it in a predictive or at least heuristic sense to explore the effects of
different controls on the region. For
example, we expect to develop some common or optimal landuse change models, but
what would happen to landuse if there were a 20 year drought? Or, growth propositions can be examined for
their potential impacts on landuse over different time scales. A major concern of the Greater Phoenix area
and other cities is EPA nonattainment of urban air quality standards. Given our fusion of real time data streams
coupled with deterministic interpolations and forecasting, we can both monitor
air quality and explore the multitude of mitigation options. Note that ASU has considerable experience in
urban airsheds and mesoscale climate (e.g., Zehnder, Environmental Fluid
Dynamics http://www.eas.asu.edu/~pefdhome/Urban.html). What would happen with a major earthquake in
the Los Angeles region? Given Phoenix’
proximity and the numerous community and commerce and infrastructure ties and
the local geology, such an event is certainly the greatest earthquake hazard
for the greater Phoenix area. Once we
have our inventory of materials and processes operating in the area, we can
much more easily anticipate the effects of such an event here. Such an event would have far reaching
implications for much of the US, and a detailed characterization of such
effects would be possible with the urban eAtlas. Lessons from that portrayal
could be easily transferred to other major urban centers.
How do environmental hazards and how changing land uses, urban
growth, economic transformations, etc. changes the 'riskscape' of city.
This could include data sources on technological hazards, point-source
polluters, area sources of hazardous emissions, mobile sources etc. Bolin and
the CAP-LTER 'Risk Group' has done some work in this area. For example, this coul include modeling ambient
pollution in the valley and how changing urban land uses/transportation
networks shifts these over time. These could be coupled with other data on
natural hazards-- floods, storms, etc. looking at all of these at different
temporal and spatial scales.
We can also use the data modeling and integration as a basis for
identifying baseline indicators of susustainability/non-sustainability of the
urban region. What are appropriate
sustainability indicators (see table 1)?
The would probably be both environmental and social/demographic. Establishing the effectiveness and
sensitivity of such indicators would clearly be transferable to other urban
systems.
Mesoscale atmospheric
circulation and precipitation model as featured model-data integration
Zehnder
and colleagues are currently running a community mesoscale model that simulates
atmospheric circulation and precipitation (the model is based on integration of
the 3-dimensional Navier-Stokes equations in time). It is initialized with
wind, pressure, temperature, etc. and the circulation evolves in response to
external forcing that comes in large part from surface heating. The surface
response to solar forcing is quite sensitive to characterization of the surface
albedo, heat capacity and moisture.
There is a great deal of heterogeneity in the surface characteristics on
the scales at which we can currently run the model (1 km or so) that is not accurately represented in the current
surface data set. We can use remotely sensed data from LANDSAT or the current EOS platforms to
better represent the surface characteristics. The response to local warm
and cool (or dry and moist) spots will
have an effect on the basin scale circulations that we wish to capture. There
is also a great deal of observational data available that we can use to enhance
the model initialization. The Maricopa County Flood control district maintains
a network of 18 meteorological stations that can be used for specifying initial
conditions and verifying the model forecast fields (Figure 3). In addition, the
Salt River Project maintains a network of mesonet stations and is generating a high resolution precipitation
data set.
Incorporating the data described above into the model will be
useful to the National Weather Service, Dept of Environmental Quality and Flood Control districts for short range
forecasting of local conditions. This would also fit into the broader
objectives of the Greater Phoenix urban eAtlas. Given projections of urban
expansion we could modify the surface data characteristics and simulate daily
and short term variations in the "new" urban area. Emphasis would be
placed on the diurnal temperature cycle, basin scale circulations and changes
in the distribution of precipitation through the valley. These are important in
determining future power/utility needs, air quality and management of
artificial lakes. One could also experiment with alternate development
scenarios and determine the changes to the future regional climate. This might
lead to optimal development schemes that minimize impact on the microclimate.
The model output described above is often difficult to interpret
by anyone other than meteorologists (and often by the meteorologists). Developing user-friendly, easy to access and
visually appealing tools for display of the model output will be easily accommodated
in our information management effort.
Education and outreach:
ARIZONA GEOGRAPHIC ALLIANCE
The urban
eAtlas articulates with several K-12 educational standards in the state of
Arizona, most notably those in Geography (see http://alliance.la.asu.edu/azga/; a
network across Arizona of more than 2700 teachers is called the Arizona
Geographic Alliance. The
"Geographic Alliance" movement is national, supported by the National
Geographic). The urban eAtlas facilitates K-12 learning and the research
process. In other words, students learn about urban growth issues, and at the
same time participate in the research process. Teacher training in the research
process would be accomplished by the Arizona Geographic Alliance through a
series of weekend workshops.
Table 2. Relevant education standards for geography
GRADES 6-8
3SS-E8.
Use geographic knowledge, skills, and perspectives to explain past,present, and
future issues, with emphasis on: PO 2.
how geography is used to improve quality of life, including urban growth and
environmental planning; PO 3. using geographic knowledge and skills to analyze
contemporary issues, including the debate over water use and availability in
Arizona
GRADES
9-12
3SS-P3. Analyze
how economic, political, cultural, and social processes interact to shape
patterns and characteristics of human populations, interdependence, and
cooperation and conflict, with emphasis on: PO 6. function and change in the
size, structure, and arrangement of urban and suburban areas, including the
growth of Arizona cities
3SS-P4.
Analyze the interactions between human activities and the natural world in
different regions, including changes in the meaning, use, distribution, and
importance of natural resources, with emphasis on: PO 6. policies and programs
for resource use and management, including the trade-off between environmental
quality and economic growth in the twentieth century
3SS-P5.
Apply geographic knowledge of people, places, and environments to understand
the past and present and plan for the future, with emphasis on: PO 1. using
geographic knowledge, skills, and perspectives to solve contemporary problems
in the community and Arizona
 Information Technology and
Information Management tools and research
Information Technology and
Information Management tools and research
See figure
5. Here, we need some serious IT techno
talk.
Commentary
from Jim George via Grant Heiken
He said
that things are moving so fast that he has the following
recommendations:
(1) Most
everything that we did is now on Open Source at www.sourceforge.net To build
upon what we have done that would be best for your purposes would take about 6
months.
(2) The
tools that we paid for are now free, including Development, CORBA-ORB, and Data
Buses.
(3) Using
XML/XSL for input specifications
(4) Worry
about authentication and security as your project grows.
Collaboration with the
Urban Security Team at Los Alamos National Laboratory
We need a
bit more here.
The Los
Alamos Urban Security team are partners in this project, focusing their efforts
on modeling, using large and diverse data sets (like the"framework"
part of Urban Security). Of special interest is the airflow and runoff studies
done by Mike Brown, Steve Burian, and Tim MacPherson and L2F by the Georges.
An
important aspect of the integrative training aspect of this project will be the
collaborative and sustained interaction through graduate student and post doc
work with the LANL team. They have had
much success with students spending extended periods at LANL in the rich,
creative, and technical environment where coding, algorithms, and scenarios can
be developed and tested, and then brought back to ASU and implemented in the
urban eAtlas, as well as applied to the urban security research problems the
LANL team is addressing.
Multidisciplinary
strengths of Arizona State University
LTER
IGERT
GIS
certificate
GIS lab/VIS
lab/ARI-LTER lab
Remote
sensing
Herberger
Center
Morrison
Institute
Greater
Phoenix 2100
Departments
Setting in
large municipality
EPA-funded
SCERP project
"Virtual
studio" with three Italian universities on the planning of Sardinia
PRISM
(http://prism.asu.edu/prism/prism/)
Integrating Greater
Phoenix area informatics efforts
Across the ASU campus and within City, County, State, and Federal
agencies, informatics efforts are underway.
This project would work to integrate as many of those as possible. The ASU GIS Lab (managed by Jana Fry;
http://www.asu.edu/gislab/) has these projects underway: Maricopa Association of Governments 2000
GIS Database Enhancement Project; Governor's Division for Children and
Arizona Juvenile Justice Commission GIS for Human Services; Brookings
Institution Metropolitan Phoenix Growth Study; Ak-Chin Native American
Community's Enterprise GIS; Central Arizona Phoenix Long Term Ecological
Research (CAP LTER) Historic Land Use Phases One and Two; Arizona
Geographic Information Council Education Subcommittee ALRIS Spatial Data CD.
The Archaeological Research Institute at ASU
(information managed by Peter McCartney; http://archaeology.la.asu.edu/) has
developed online publications of archaeological research datasets with metadata
and directed several large collaborative database projects serving management
and academic needs. Peter McCartney and
others were recently funded for a National Science Foundation Biological
Databases and Informatics (BDI) project entitled: Networking Our Research
Legacy: Infrastructure to Document, Manage, and Access Ecological Data
Resources. Their primary concerns
are access to primary data, Locating and identifying relevant information,
Diverse and dynamic state of information storage formats, and Targeting user
audiences. We expect to work closely
with the BDI project and extend the tools that they develop.
The ASU Geological
Remote Sensing lab (http://elwood.la.asu.edu/grsl/) has world class expertise
in the development and application of remote sensing to geological and
environmental studies. Current projects
include: Phoenix Land Cover Classification using Landsat-TM (NSF--CAP-LTER),
and Global Urban Land Use/Change using ASTER (NASA). Online data include: CAP LTER Landsat TM data server, Historic
Landsat TM/MSS and AVHRR data, Arizona State 1993 Landsat TM Image Server, TIMS
and NS001 Data Archive, CAP LTER Land Cover Classifications, and MASTER Data. A related innovative project was the City of
Scottsdale Remote Sensing Project (http://TES.asu.edu/asu_tes/TES_Editor/SCOTTSDALE/scottsdale.html). Researchers were able to significantly
optimize stormwater estimation by application of remote sensing analysis to
determination of perviousness of surfaces.
Along with the above
ASU facilities almost every city and numerous county, state, and federal
agencies manage digital data and this project will provide a coordinating
umbrella to minimize duplication and to maximize completeness of spatial data
use.
Management plan and
budget
The project will be lead by the Arrowsmith-Steiner team with
significant input and interaction with colleagues from across ASU and other
Greater Phoenix 2100 stakeholders. We
will follow the model of strong collaborative ties among the diverse
disciplinary interests that has developed in LTER and IGERT. We envision that disciplinary teams of
faculty, postdoctoral scholars, and graduate students will work together to
discover, compile, quality control, and work with data from their general
disciplinary area. The disciplinary
areas are: biophysical
features, built environment, and demographics.
Each includes a modeling componenent. The analysis and synthesis of the data, application to modeling,
and development of visualization and access tools will make up the bulk of the
research of the project. We believe
that the project will find focus if its development includes research in
aspects of its production, idealization, and application. Therefore, we expect to offer eight graduate
research assistantships per year that will be awarded on a competitive basis to
colleagues who submit short proposals to the management team. Evaluation will include intellectual merit,
appropriateness for overall goals of Greater Phoenix 2100, and sensitivity to
the continuity of thesis and dissertation projects. Note also the collaborative
extended training visits to our LANL partners by the students and post docs as
described above.
We will need an Information Technology specialist to manage the
technical coordination of the project.
We also request support for a professional Education and Outreach
(E&O) staff member who will work to present the interactive opportunity of
the Greater Phoenix project to educators and students, decision makers and
citizens, and natural and social scientists.
We hope that people from all levels of interest will find the
interaction with the data and models fascinating. Education and outreach will include the development and testing
of explanatory and training materials and lesson plans.
Along with the E&O, we firmly believe that a graphic designer
will be helpful in a number of ways.
First is the element of information design that will be required in
visually translating data and model results as well as the process of making
such information about the greater Phoenix area accessible to people.
Information design as it relate to organization, iconography, hierarchy,
communication and comprehension will be important aspects of this project. Secondly, interactivity as it relates to
the information and the overall outcome will be an important consideration. How
will people use and access this information and how could it be enhanced by an
interactive context? There are some exciting possibilities with incorporating
digital media into the project, but
efforts must be made to make the results user friendly and appropriate to the function as well as
visually successful.
We do not expect to have to buy very
much data. Most of the expense will be in the transformation of the data to
common reference frames and representation schemes. Physically, this project and its staff would be housed adjacent
to either the GIS lab or the ARI-LTER GIS lab and would include a series of
servers and workstations along with peripheral devices and the Data and
modeling theater.
Multi dimensional
planning (advisory) council
Acting in an advisory and review
mode, prominent social scientists, economists, politicians, scientists, and
interested citizens will work with the management team. The council will provide focus while also
checking for completeness for databases, scenario generation, and promotion of
the project to the Greater Phoenix 2100 community and beyond. Potential members include: Jim Holway, former City of Phoenix Mayor;
Ray Quay, assistant Phoenix planning director; Rita Pearson, ???; and some
others….
Schematic budget (in $k)
|
Budget
summary
|
|
|
|
|
|
|
|
Numbers
are in $k
|
|
Year 1
|
Year 2
|
Year 3
|
Year 4
|
Year 5
|
|
Category
|
|
|
|
|
|
|
|
Staff
|
|
|
|
|
|
|
|
|
IT
Information Manager ($60k/yr)
|
60
|
62
|
65
|
67
|
70
|
|
|
E&O
staff ($50k/yr 50% FTE)
|
25
|
26
|
27
|
28
|
29
|
|
|
Graphic
design expert ($50k/yr 50%FTE)
|
25
|
26
|
27
|
28
|
29
|
|
|
Sysadmin
($50k/yr 25%; except first year to set up)
|
25
|
13
|
14
|
14
|
15
|
|
|
Professor/PI
summer salaries (4)
|
24
|
25
|
26
|
27
|
28
|
|
|
Post Docs
(4 @$30-$35k/yr)
|
140
|
146
|
151
|
157
|
164
|
|
|
Graduate
students (8 @ $20.8k/yr--AY 50%FTE and summer 100%)
|
166
|
173
|
180
|
187
|
195
|
|
Fringe
(17% for staff and 9% for students)
|
|
201
|
206
|
215
|
223
|
232
|
|
Total
Salaries and Fringe (assumes 4% cost of living increase per year)
|
|
666
|
677
|
705
|
733
|
762
|
|
Operations
|
|
25
|
25
|
25
|
25
|
25
|
|
Hardware
|
|
|
|
|
|
|
|
|
Servers
(3)
|
45
|
|
|
|
|
|
|
Workstations
(lab and offices)
|
24
|
|
|
|
|
|
|
Peripherals
(printers/plotter/digitizer/scanner)
|
50
|
|
|
|
|
|
|
Disks and
tape drives
|
10
|
|
|
|
|
|
|
Network
|
10
|
|
|
|
|
|
|
Data and
modeling theater
|
150
|
|
|
|
|
|
Total
direct
|
|
980
|
702
|
730
|
758
|
787
|
|
Indirect
costs (52.5% of direct not including permanent equipment)
|
|
363
|
369
|
383
|
398
|
413
|
|
Total per
year
|
|
1343
|
1071
|
1113
|
1155
|
1200
|
|
TOTAL
|
|
|
|
|
|
5882
|
The ASU commitment to this project
(in addition to the major support for the CAP-LTER and the Urban Ecology IGERT)
will be sufficient space and an Environmentally friendly IT type.
Letters of support and
collaboration
Jack
Dangermond, ESRI
Grant
Heiken, LANL Urban Security group
Ray Quay,
City of Phoenix
References
Knowles-Yánez,
Kim, Cherie Moritz, Jana Fry, Charles L. Redman, Matt Bucchin, and Peter H.
McCartney. August 1999. Historic Land Use: Phase I Report on Generalized Land
Use. Central Arizona - Phoenix
Long-Term Ecological Research Contribution No. 1, Center for Environmental
Studies, Arizona State University, Tempe.