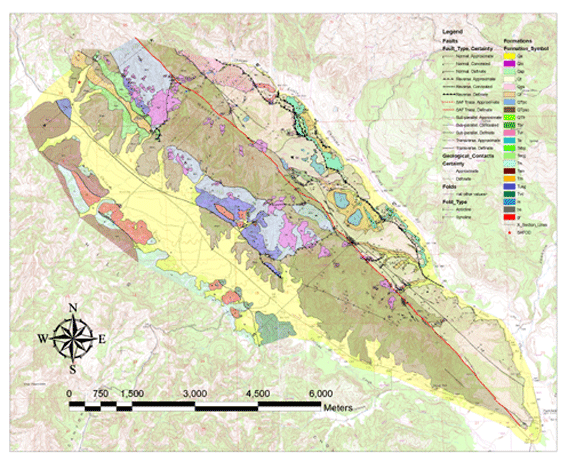
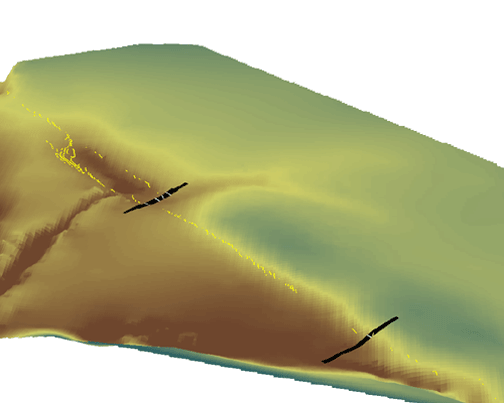
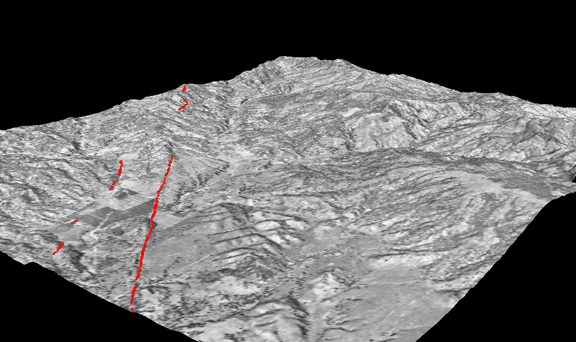
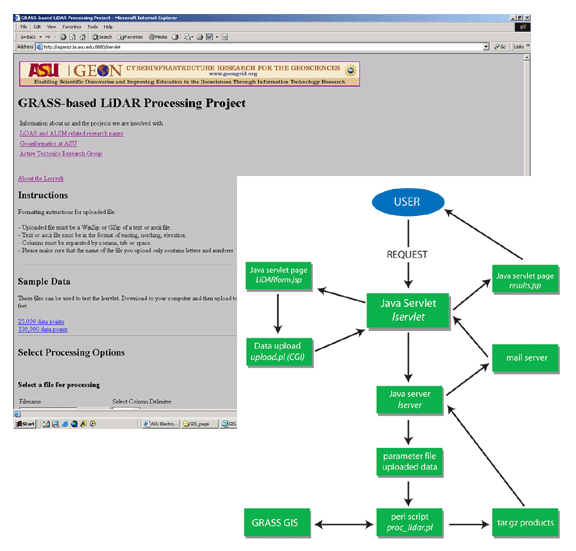
The active tectonics group at ASU has compiled a number of geologic field maps related to research on the San Andreas Fault zone near Parkfield, CA into digital format through the use of ArcMap GIS software. Field maps were first rectified into the UTM Nad 1983 coordinate system. Next, all contacts were digitized to polyline feature classes, and finally, polygons were created that were bound by the contact polylines. This large dataset was managed through the use of various attribute tables associated with each feature class.
- REFERENCE:
Thayer, M.R., Arrowsmith, J R., Young, J. J., Fayon, A., Rymer, M.J., 2004, Geologic structure of Middle Mountain within the San Andreas Fault zone near Parkfield, California, Eos Trans. AGU, 85 (47), Fall Meet. Suppl., Abstract T13A-1335, 2004.
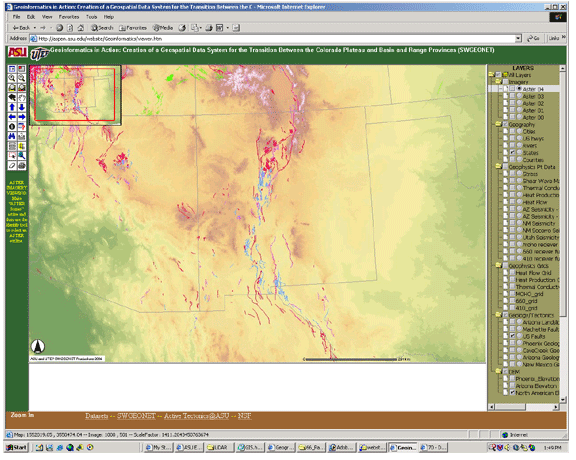
For more information on this project please visit our Geology and Geomorphology of the San Andreas Fault near Parkfield, CA page.