4628 IBW @ McDonald
The data
showflow.html
mcdonald.txt (header removed)
Views of the data
Code for processing: processMCFDQ.m
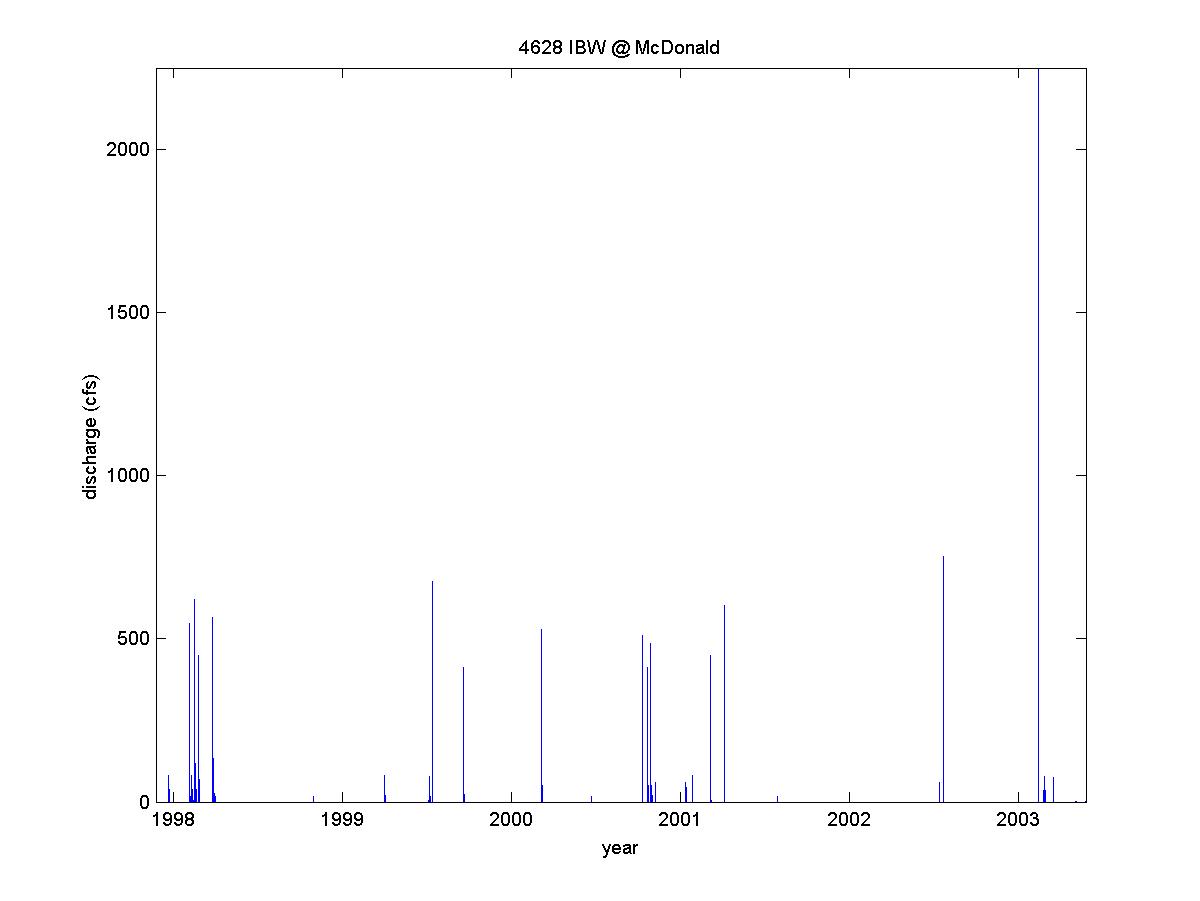
Figure 1. Discharge versus time over the period of record.
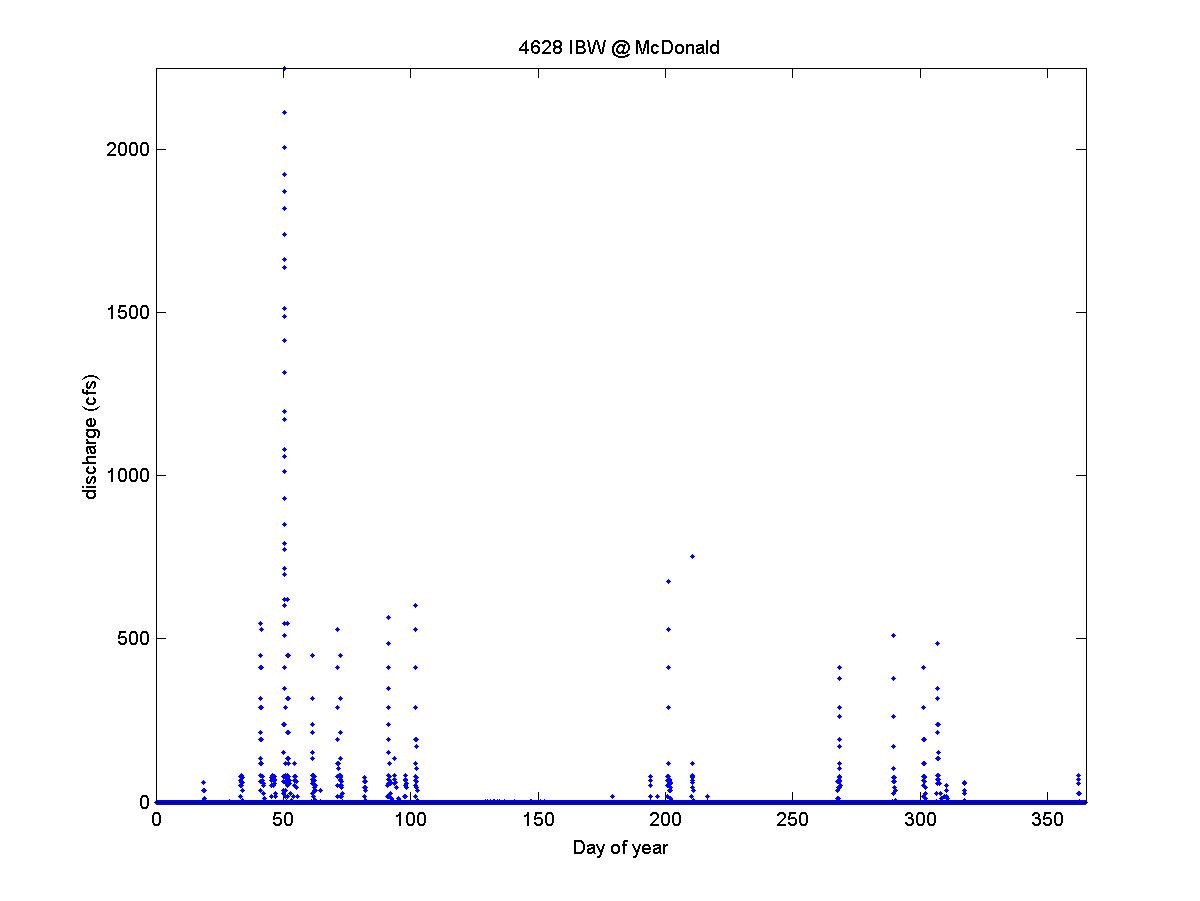
Figure 2. Discharge versus day of year. This is all of the data from Figure 1, but it shows the days of year when there has been flow.
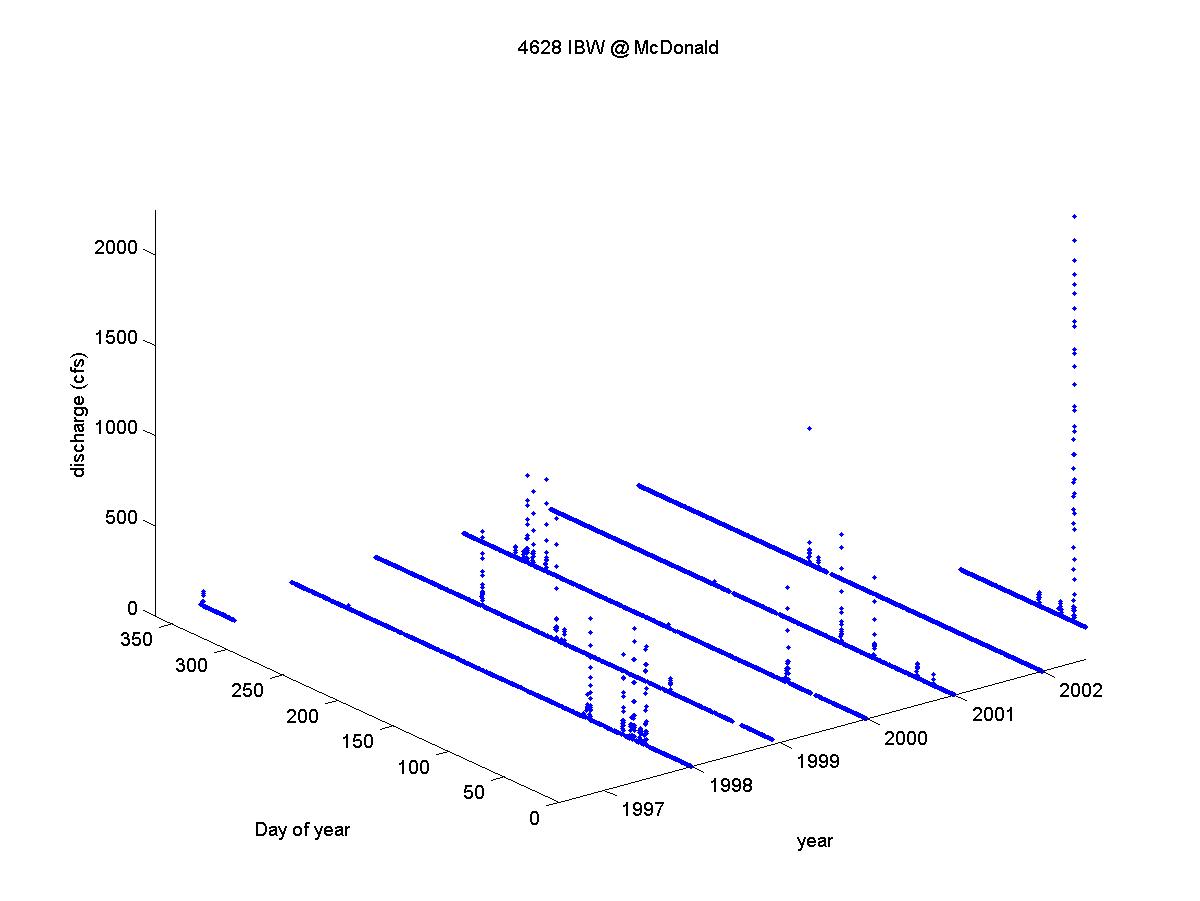
Figure 3. Discharge versus day and year over the period of record.
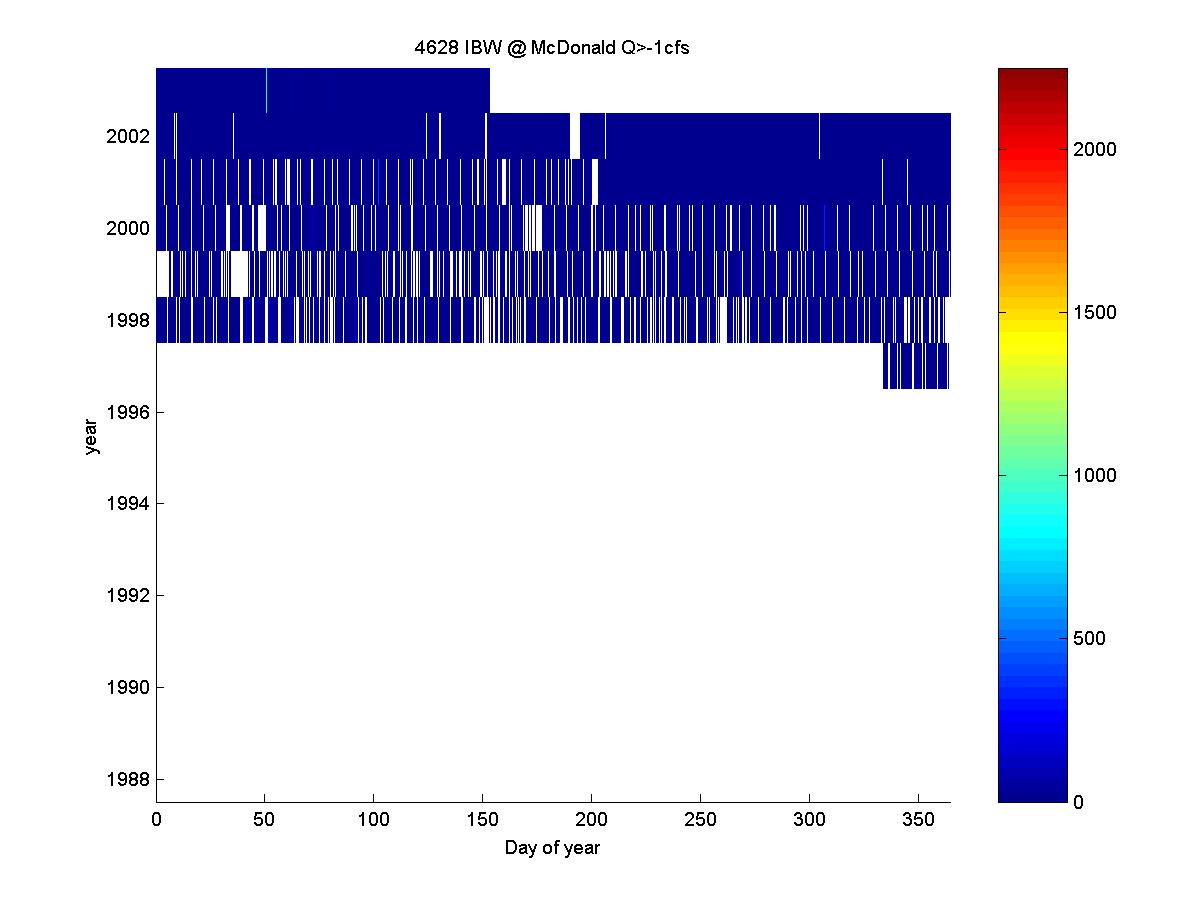
Figure 4. Discharge versus day and year over the period of record. This shows all of the data (that is why it says Q>-1 cfs). It is hard to see the bigger flows in this depiction.
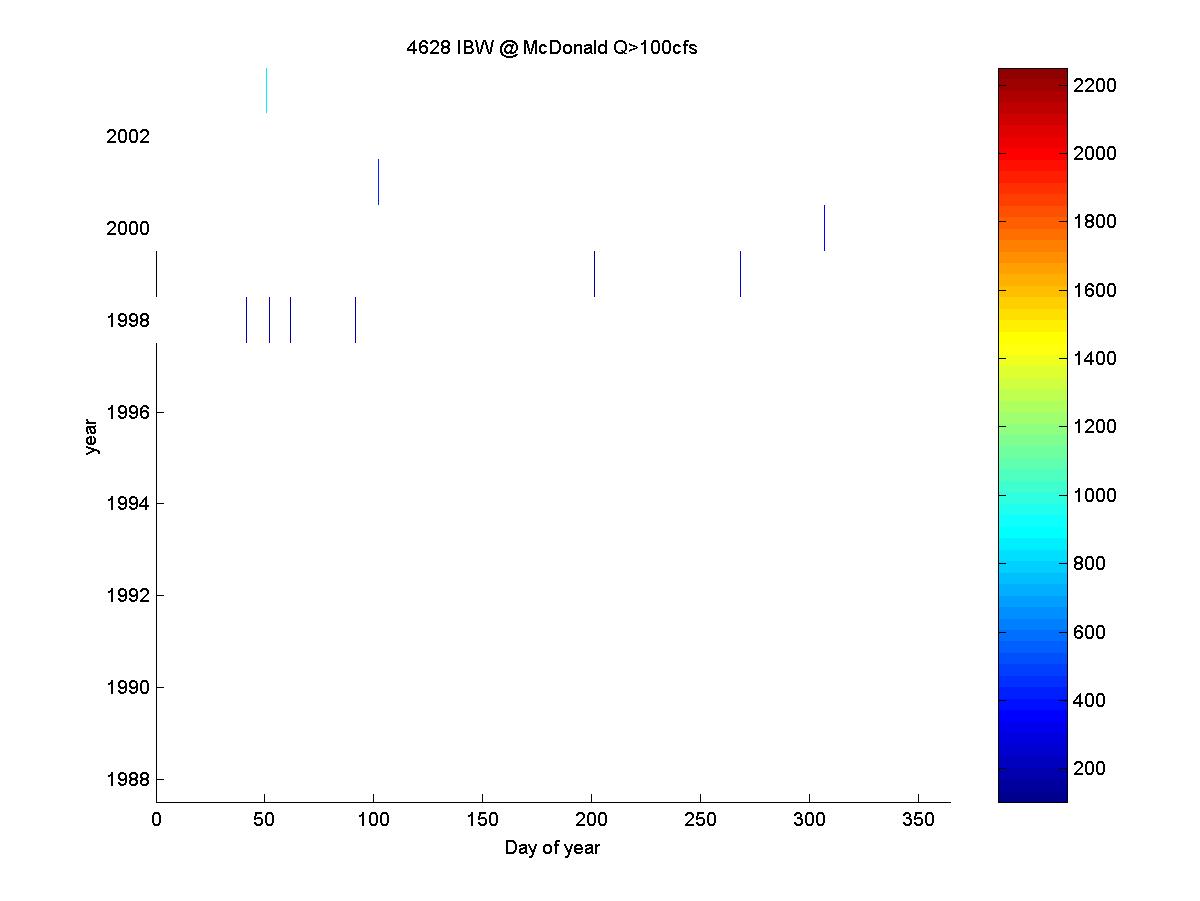
Figure 5. Discharge versus day and year over the period of record. This shows flows for Q>100cfs. It is hard to see the bigger flows in this depiction. It shows a little bit better the periods of flow.
Return to IBW Discharge analysis
Ramón Arrowsmith
Last modified May 28, 2003.