GLG410 Computer Project Webpage
Methods
 To take samples from this basalt face, we first marked the sample points with
orange tape. The tape was covered with rubber cement (used to keep the pieces of
the chip together after it was taken off the face). Each piece of tape was
marked with a sample number before application of cement. We selected sample
points randomly, while trying to get even coverage of the face. The biggest
problem keeping us from setting up an ideal arrangement of data points on the
face was the difficulty of taking samples from certain areas of the face. The
easiest places to sample were spots along cracks in the face, and other
features.
To take samples from this basalt face, we first marked the sample points with
orange tape. The tape was covered with rubber cement (used to keep the pieces of
the chip together after it was taken off the face). Each piece of tape was
marked with a sample number before application of cement. We selected sample
points randomly, while trying to get even coverage of the face. The biggest
problem keeping us from setting up an ideal arrangement of data points on the
face was the difficulty of taking samples from certain areas of the face. The
easiest places to sample were spots along cracks in the face, and other
features.
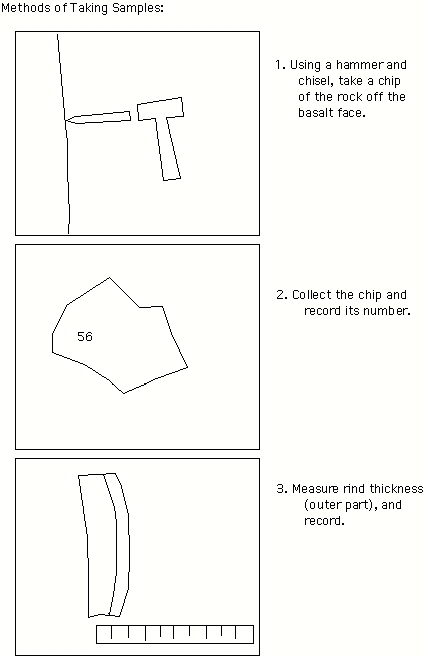
We sampled with a hammer and chisel, as illustrated in the first panel of the
cartoon to the right. We chipped these off the face either standing on the
ground, standing on the ladder, perched precariously on a small ledge on the
face, or suspended by webbing from the top. We collected the samples, marking
each ziploc baggie with the sample number.
The final step actually involving the chips was to measure the weathering
rind thickness. These were all measured by Lee, and it was a long and
tedious process. The weathering rinds are very thin, almost always less
than one millimetre. So they are a little bit difficult to measure.
We collected the sample point locations by use of a TOTAL station. This
data was in the form of azimuth, elevation, and range (direction, height
from the total station, and distance from the total station). Next the data
was taken out of the TOTAL Station, and edited into Excel, where it was divided
into Easting, Northing, and Rind Thickness columns. These columns were made into
text files, and pulled into Matlab to make the contour
images.
Once the contour maps were made, I imported them into Imagine to rectify
them, along with a digital camera photo of the scarp. I rectified the
image to the contour map for a scientifically accurate representation. I also
rectified the contour map to the image for a representation which is a
little easier to analyse visually. The rectified images can be seen on the results page.
Back to Wupatki project page
Back to Active Tectonics